Visualization: Custom legend markers and colors #678
Comments
|
Boxplot Viz is done via #251 |
|
@moontrip
I am attaching photos |

|
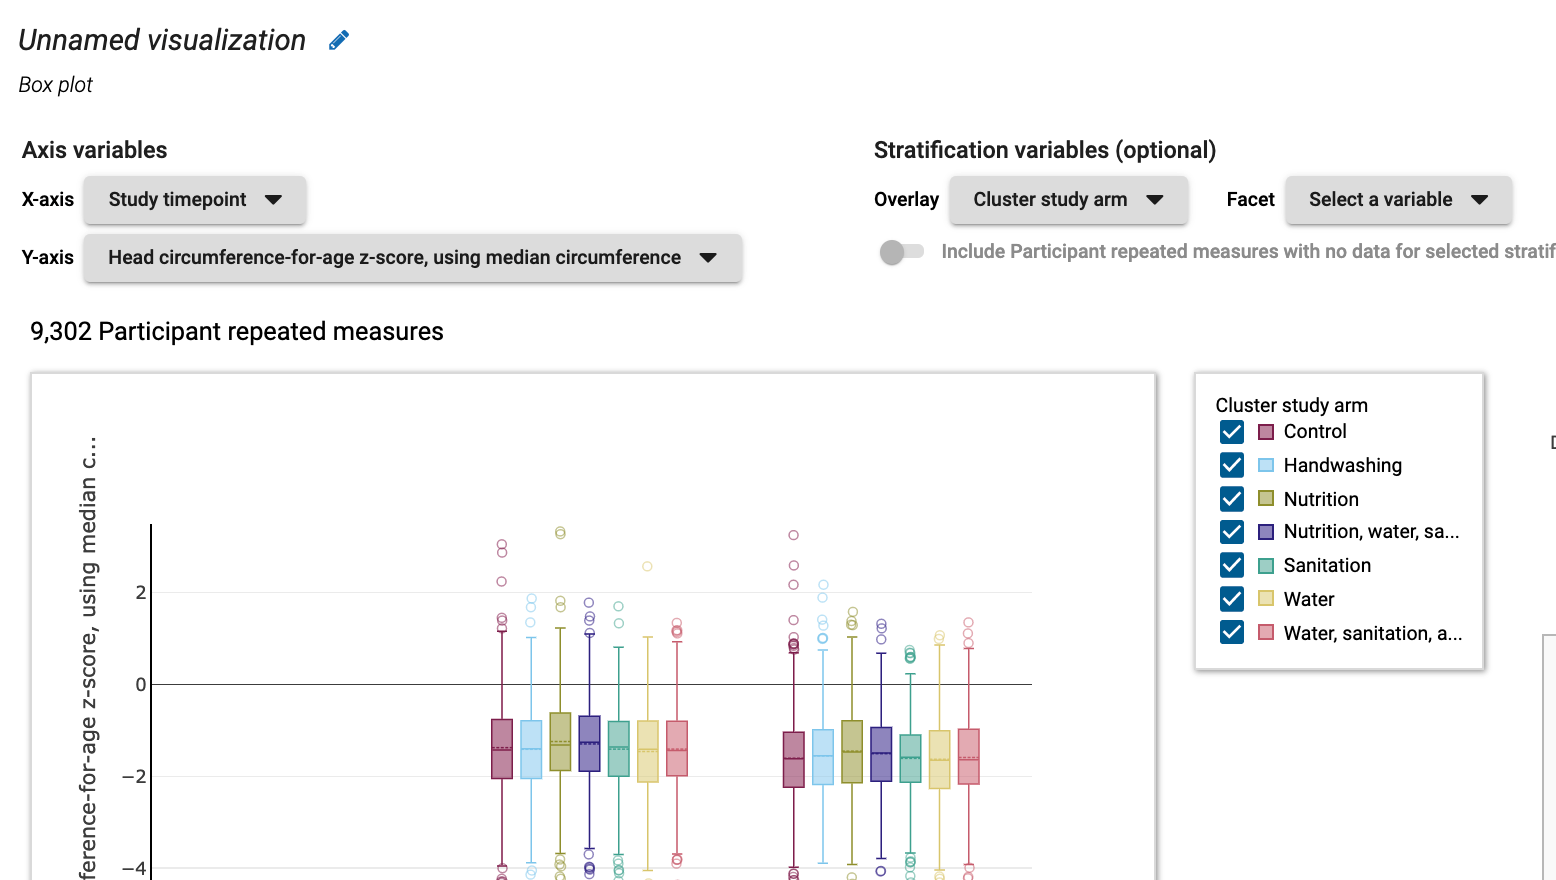
@sweverschulman Thank you for your review and tests. Sorry that it is not clear of your question 1: The attached one is boxplot and you are saying scatter plot legend. FYI, it seems that my custom legend works for the scatter plot (and possibly the latest works from developers) are not updated correctly at qa/qa.restricted: asking Dave about this. So, if you are asking about the style of scatter plot then yes they are almost identical to what the Plotly's default legend shows. You can see my screenshot in this link, which shows what the new markers/colors of custom legend for the scatter plot look like. As for the number 2, unlike Plotly's default legend that offers clicking texts, we are not supporting it. This is the reason why we have introduced checkbox instead, which controls on-off plot trace(s). Hope this would be helpful for you. |
|
thanks @moontrip. So to clarify the custom legend this. |

|
@sweverschulman yes correct. FYI, Jamie just committed his work for overall layout of plot, custom legend, bird eye plot, and table: certainly not reflected at as site yet. Also, we will disable the Plotly's default legend sooner or later and stick to the new custom legend instead for both regular plots and faceted plot. |
|
the new custom legend markers and colors are present in both scatterplots and boxplots |

Uh oh!
There was an error while loading. Please reload this page.
while a prototype of custom legend works are done, it is still required to add markers at legend labels like plotly's legend. A basic square markers are already made at #637 which would work for histogram, barplot, mosaic (2x2 and RxC) Vizs but still need to consider two more cases, scatter plot and boxplot Vizs. This ticket will handle the task.
The text was updated successfully, but these errors were encountered: