Index translogs can get stuck after node failure, doesn't get smaller when flushed anymore #29488
Comments
|
@danopia Would you mind sharing the shard-level stats with us? This can be retrieved via |
|
Pinging @elastic/es-distributed |
|
Sure. I have a hundred indexes so hopefully just stats from just one impacted index will be useful. Index: It's been an hour since I wrote into this index, and repeated synced-flush attempts say things like "pending operations" and "commit has changed" for many shards. Most recent synced-flush output: https://gist.github.com/danopia/79cf1394b9806cf374c6ea16c90f9623 Shard-level stats for that index: https://gist.github.com/danopia/af7b5df82b3d939e6e99df87cabb8b01 Thanks for the fast response :) |
|
Thanks @danopia I want to double check a few things:
Can you clarify a bit more about what you mean? Did you stop indexing while replicas were still recovering or were you trying to move the indices to another node? |
Sure. When I see translogs not being cleared, I manually stop all indexing until I see fully-allocated hot indexes. Usually I just make new empty indexes, wait for them to allocate, then start indexing with the new indexes. If the new index translogs aren't stuck, this is all good. (One time, I made a new index, then performed a full cluster restart to fix a systemd config, and none of the translogs on that new index worked once I started putting data in) Anyway, a pain point here is that any future recoveries that involve a broken shard can take hours to complete. At worst, I had a full index of translogs with 67 million entries each, and each recovery took upwards of 10 hours. ES tried to rebalance and used up all the file descriptors, crashing multiple nodes. Then the primary shards had to read the entire translog in order to recover from existing store, so my cluster was red for that entire time. Replicas also took just as long to do a peer recovery. Here's a screenshot of those recoveries:
Basically, once I have these broken indexes, any sort of node restart (config changes) or node failure starts the whole recovery ordeal over again. Going by #28205 it sounds like Elasticsearch doesn't have the capability of seeking into the translog, so I assume it was reading all of those entries just looking for the end. |

|
Maybe this is related? Doesn't read like the same trigger, but I'm seeing the same behavior with # of open files, around the same time. #29097 |
|
Thanks @danopia . Let's first try to reduce the number of moving parts.
I'm not sure whether this achieves what you want - every operation written to the translog is fsynced at the end of each bulk. The flush parameters controls how often a lucene commit point is made and not how much documents are held in memory before the translog is written to disk. Since recovery first copies over lucene files, it uses the commit point. If the commit is very old (i.e., 5gb behind) you need to re-index a lot of data and recovery will be slow. Another side effect is that while a recovery is ongoing we can't trim the translog. So if takes a long time and you index really quickly, the translog can get very large. I suggest you go back to using defaults and see what effect it has.
It sounds like you were doing this while the indexers were running. If so it's expected. Synced flush only works when no indexing is going on.
We can random access into the translog with a granularity of 64MB. That's good enough for recovery, not good enough for other stuff (hence the issue you linked to).
You symptoms are similar because you translog is huge. I think the cause is different. Can you please reduce the translog flush size to default (set it to null, it's a dynamic setting) and see how things go? I don't expect them to be solved but I think it will be easier to figure out. |
|
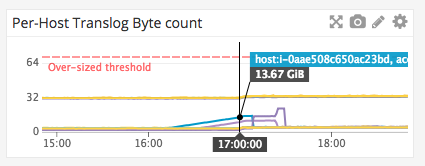
Sorry for the radio silence. I removed the translog size override from all my clusters, thanks for the heads-up. The metrics are smoother now. After my last comment I upgraded the aforementioned cluster to a 6.2.4-SNAPSHOT (using this tree) based on a belief that #29097 was at play. The upgrade didn't fix the translogs (as you expected), but does fix the out-of-files crashes. The number-of-files metric has been beautiful ever since. No.FDs is what was actually crashing nodes and destabilizing clusters. This means I can take my time with the translog investigation. (The fun part was losing visibility while 6.2.4 was fixing the number-of-files. The node's stats were completely unresponsive for the hour or so that ES needed to clean up all the files, for each cleanup that happened.) Anyway, after the upgrade was completed: Four translogs (2 shards out of 9, +replicas) got stuck on the same day without a known cause. They just stuck in-sync. ~12 hours later at 17:00PT, indexes rolled over and the new indexes cleanly took the load.
"POST /dice.prod-2018.04.17/_flush/synced"
{
  "_shards": {
    "total": 18,
    "successful": 18,
    "failed": 0
  },
  "dice.prod-2018.04.17": {
    "total": 18,
    "successful": 18,
    "failed": 0
  }
}
A week later, I purposely caused other translogs to inflate, by starting recovery on a hot index. Once the index was rolled over, the recoveries completed and the translogs were properly trimmed in a reasonable timeframe. But the stuck translogs are still there. In the same cluster!
Hopefully running a SNAPSHOT doesn't invalidate all this information. But if it does, I have another cluster running real 6.2.4 and with multiple instances of the stuck-translog symptom. I'm waiting to see if the cluster going green helps that one. |

|
@danopia It would be helpful if you can provide this information.
Thank you! |
Do you have a possible cause for bulk errors causing translog poison pills of some kind? It sounds like a lead.. |

@danopia Thanks again. I think we have figured out the source of the issue and fixed it in #30244. @bleskes WDYT? |
|
Nice, good to see there's a known thing that correlates :) I've consulted the logging cluster that my clusters log to, and definitely see this from the time period of the above graphs:
Other unaffected days don't have that log. Sounds like the fix in 6.3.0 won't fix old data, so I'm not looking forward to reprocessing all the tranlogs I've accumulated 😛 [edit] Just noticed a referenced issue mentioning an open/close fixing the indexes, so I'll see what that does for me |
You can fix the affected indices by rebuilding its replicas. This can be done by changing the |
|
@dnhatn @bleskes @danopia - I understand this is now fixed 6.3+ but had a quick question on the impact of diverging local checkpoints. When i hit this scenario on 6.2, translogs growing beyond tldr; Are the translog retention settings ignored if the local checkpoints diverge? Ideally it should not right? But maybe the primary needs to keep all sequence-ids around since last |
|
@malpani the translog is used for two things - the first is to reindexing all operations into lucene in the case of a restart. For this you need all operations above the global checkpoint (which is the minimum of the local checkpoints). The second things is to bring replicas that were offline up to speed using operation recoveries (they come from the translog in the 6.x polices). The first usage is required and we always keep the required portion of the translog for it (this is what you're seeing). The second usage is optional as we can always copy files. The retention setting controls how much of the translog should be kept around for the second usage alone. I hope this helps. If you have more questions please feel free to ask on our discuss forums. We try to keep GitHub for feature requests and bugs. |
Elasticsearch version: 6.1.2, from https://artifacts.elastic.co/packages/6.x/yum
Plugins installed: discovery-ec2, repository-s3
JVM version:
OS version: Amazon Linux 2.
Linux ip-10-2-45-153.ec2.internal 4.9.76-38.79.amzn2.x86_64 #1 SMP Mon Jan 15 23:35:15 UTC 2018 x86_64 x86_64 x86_64 GNU/LinuxDescription of the problem including expected versus actual behavior: When a cluster isn't green, translogs have a tendency of not getting trimmed anymore. Flushes sure work, and the
uncommitted_sizeof the translog goes down, but the whole translog sits there reaching into hundreds of gigabytes. I've tried the _flush API, the synced-flush API, and really any API I can find. Expected behavior: the translog size should match the uncommitted_size after a flush, unless there is an ongoing recovery on that shard.Relevant stats from an index I haven't written to in at least 12 hours:
Full stats from that index: https://gist.github.com/danopia/7390f5bbb898bfe4c2b3709a503539ec
Steps to reproduce:
Pretty hard for this issue (I haven't tried to cause this problem) but here's some general steps.
Wait for an Elasticsearch node to die. I had two clusters exhibit this behavior, one initially caused by ES running out of file descriptors (since been addressed), the second was EC2-level instance failure.
Create a new fully-allocated index and continue writing into it.
Observe that while the existing data recovery is ongoing, the new indexes can get translogs that grow unbounded.
Once an index has a translog in this state, no combination of API calls can fix it.
The worst part about the stuck translogs is even after I've moved on from indexing into those indexes, they're still in the cluster and take AGES to recover. I'm talking multiple hours per shard recovery because the entire translog must be read in order to recover from existing store, and then read AGAIN to recover a replica. So I'm not aware of any options other than deleting the impacted indexes or living with that.
Some impacted indexes have "Too many open files" logs, others have zero mentions in ES errors. So it's not a requirement but I'm including some such log lines for completeness.
With this issue I'm looking for reasons why I can't fix the translogs once they grow unbounded. I'm not entirely sure on the root cause of the unbounded growth, and it's less important as long as I can fix it after... but the root cause really seems to be related to recoveries and the amount of file descriptors that recoveries require.
Here's a graph of a totally healthy cluster getting hit by an EC2 failure, and then spiraling into craziness. Wednesday around 12:00 I performed a full-cluster restart to 10x the file descriptor limit.
The text was updated successfully, but these errors were encountered: