Bug Report: #346
Comments
|
This is not a bug. Rather you are trying to plot more data than the size of your plot and resolution of your screen can handle. You can try making your plot larger, and/or plotting fewer candles, or resampling: Please click here and carefully read through this issue and then let me know if you have any further questions. Thanks. |
|
It most certainly is a bug. I specified candles and got a line. The fact that you can explain why it's happening and point to possible solutions does not mean it's not a bug. There is no warning on why its happening, and no way to know how to fix it if it does happen. |
You are plotting 1883 candles. Think of it this way: Let's say your monitor is 24 inches wide (and let's assume your monitor has more than enough pixels, say 20,000 pixels across, to clearly draw the candles). That means each candle is going to be less than 0.0127 inches wide. That's about 1/3 of millmeter. While possible to see, if you look very closely, it will still be difficult for your eye to see each candle as anything more than a small line (being as your eye would need to distinguish 3 candles in the space of 1 millimeter!) Now consider your monitor. What is the resolution of your monitor? Mine is basic HD, or 1920x1080. On my monitor, 1883 candles means each candle is going to be about 1 pixel wide (with no space between candles). Thus it impossible for the monitor to draw a candle. Presently, the maximum resolution monitor available to consumers is 8K, which is 7680 x 4320 pixels: this monitor will have only 4 pixels with which to draw the width of each candle, or 3 pixels if you leave 1 pixel of space between each candle. Can you see clearly 4 pixels on your screen?? If you can find me a software package and consumer available monitor (or printer) that can clearly display 1883 candles in a single plot, then I will be willing to consider this a bug and do what I can to improve the mplfinance package.
This is perhaps a good point. I don't want to waste code to determine the resolution and size of the user's monitor, but I suppose mplfinance can make a reasonable guess as to when a user is attempting to plot more candles than can be displayed by any typical high-end computer, and perhaps issue a warning. Please let me know if you have any further questions. |
Describe the bug
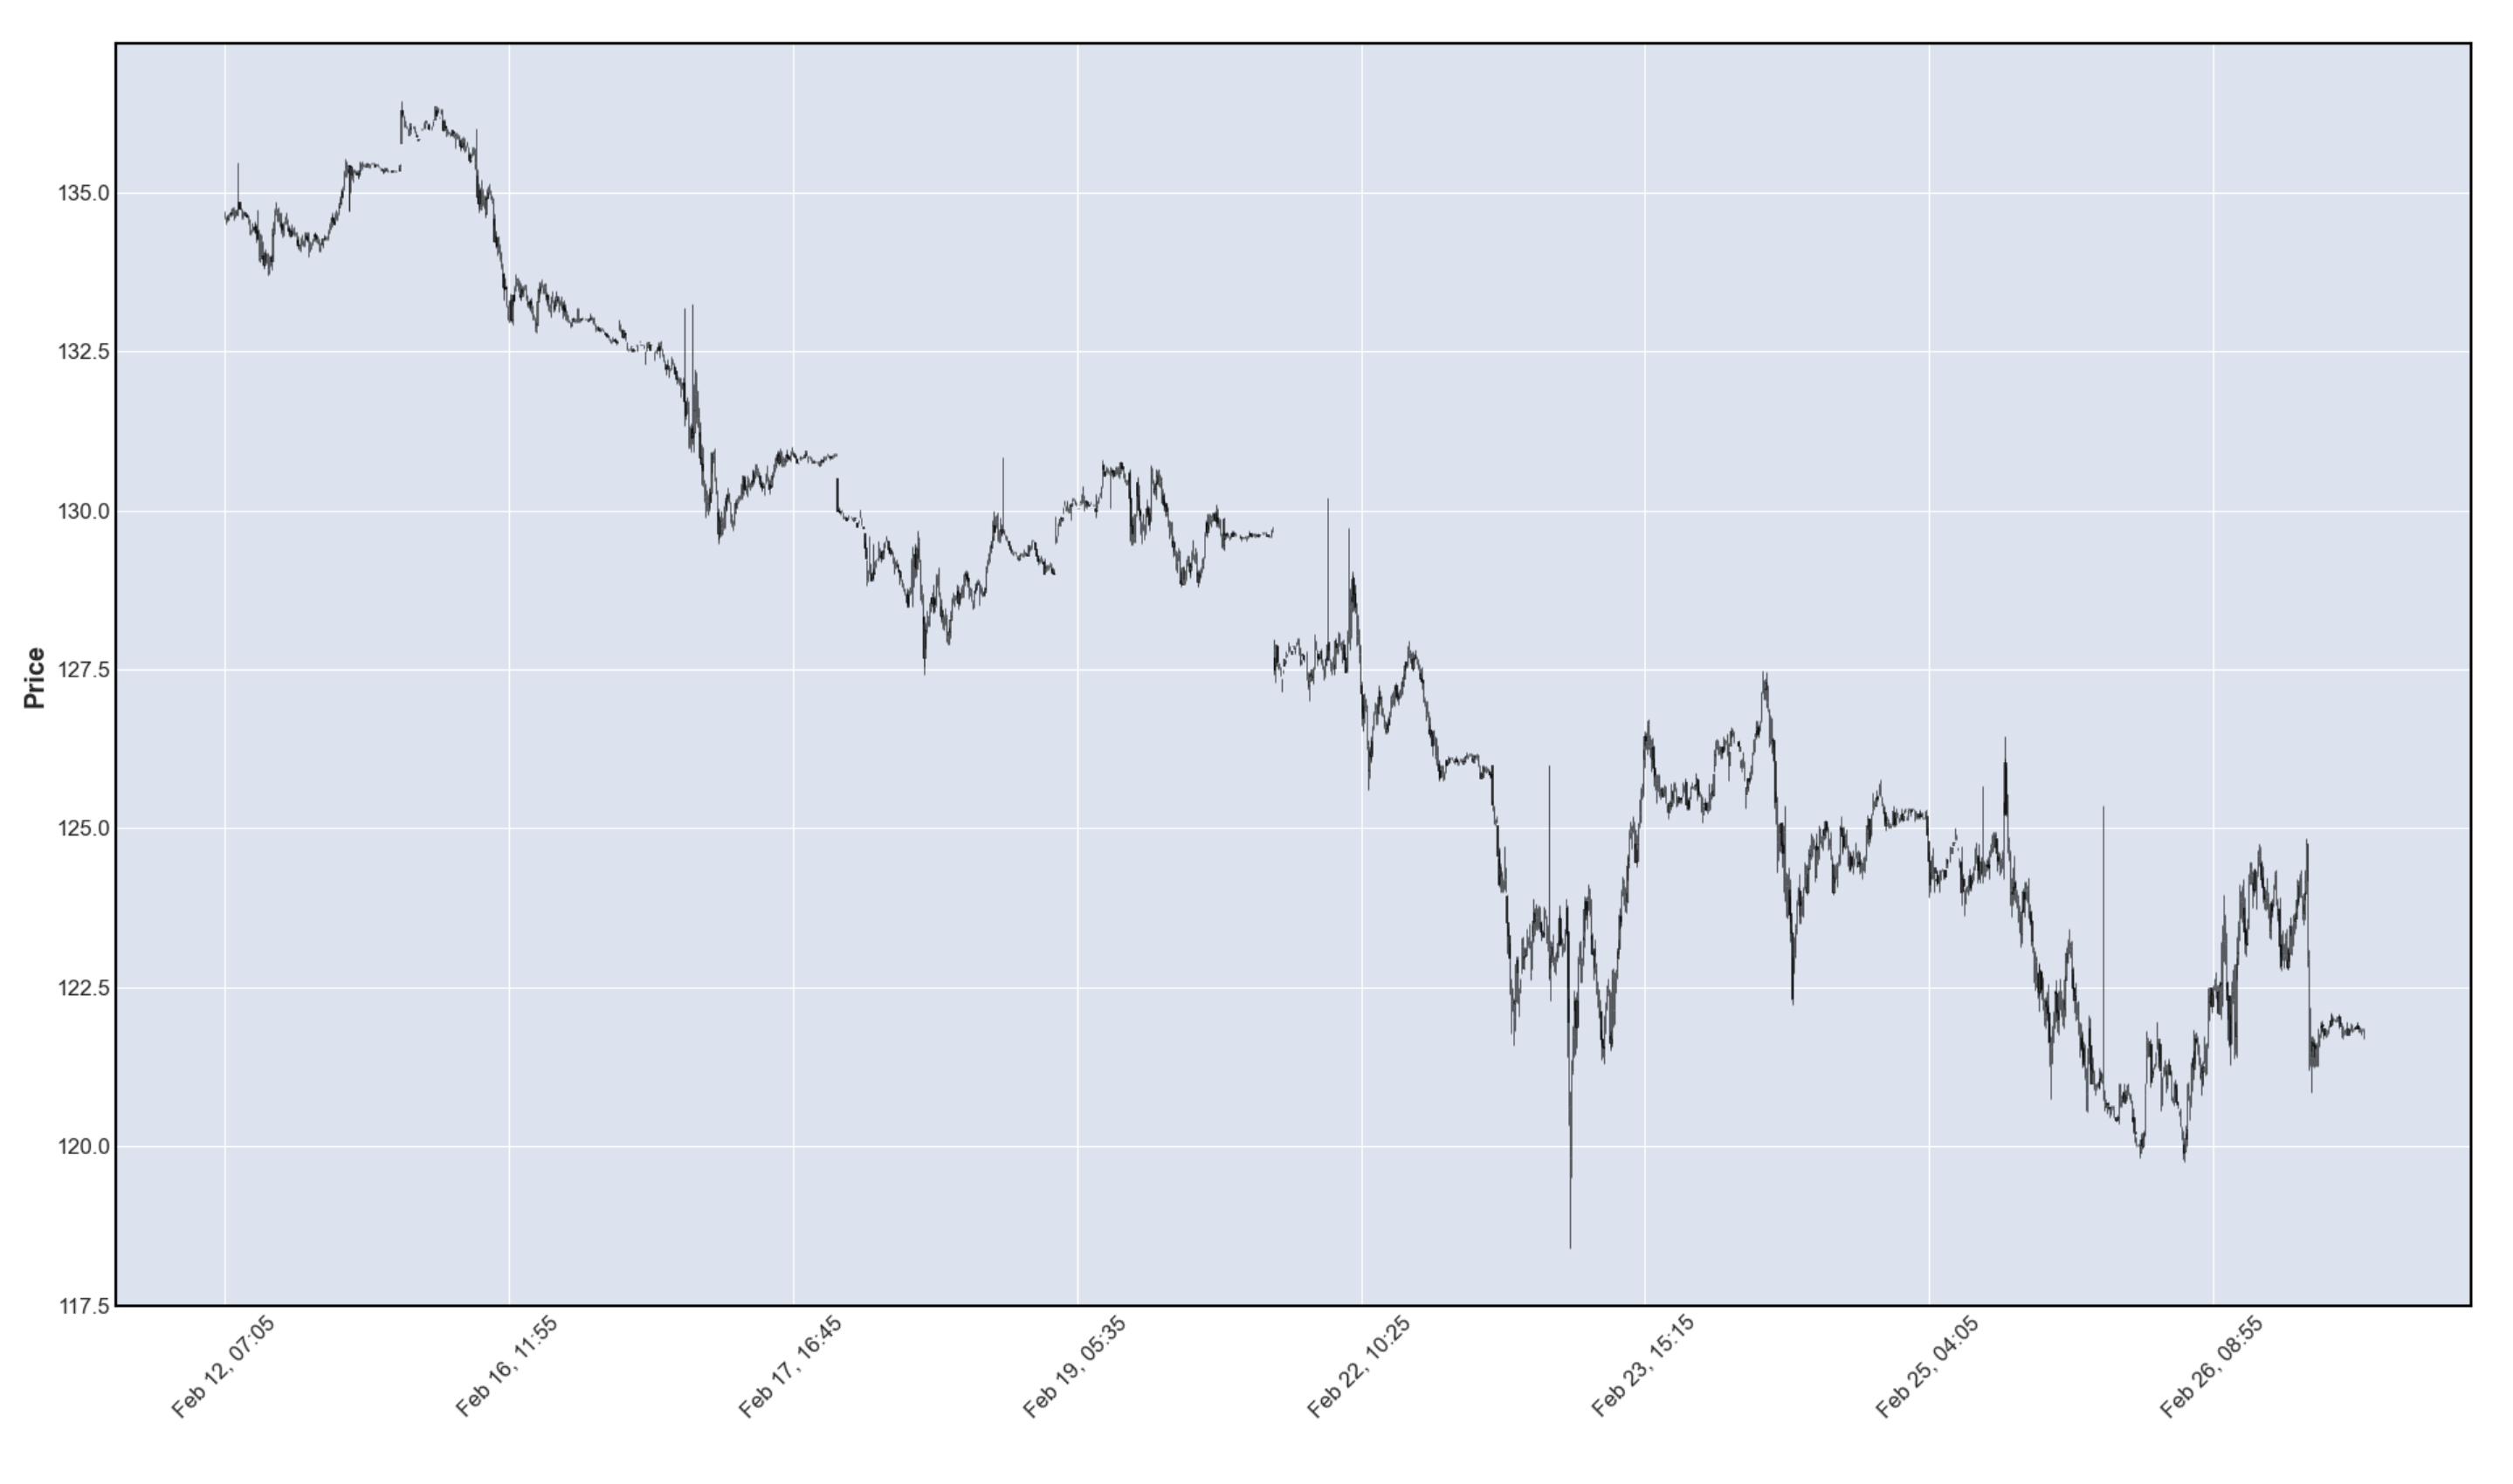
mpf.plot(data,type="candle") generates a line graph.
To Reproduce
Steps to reproduce the behavior:
create OHLC dataframe... something like this:
Expected behavior
something resembling a candle graph is made
Screenshots
If applicable, add screenshots to help explain your problem.
This is made. No errors of any kind
Desktop (please complete the following information):
The text was updated successfully, but these errors were encountered: