Skip to content

IV curve fitting #1228

New issue

Have a question about this project? Sign up for a free GitHub account to open an issue and contact its maintainers and the community.

By clicking “Sign up for GitHub”, you agree to our terms of service and privacy statement. We’ll occasionally send you account related emails.

Already on GitHub? Sign in to your account

Open
toddkarin opened this issue May 13, 2021 · 20 comments
Open

IV curve fitting #1228

toddkarin opened this issue May 13, 2021 · 20 comments

Comments

@toddkarin
Copy link

@cwhanse I am trying to fit IV curve traces from the NIST dataset available here: https://pvdata.nist.gov/

Why doesn't pvlib.ivtools.sdm.fit_desoto_sandia provide a diode factor fit for each run?

It is unclear why we must input v_oc, i_sc, v_mp, i_mp since the IV curve is given. Could it be possible for fit_desoto_sandia to extract these values automatically?

It would be helpful if you can check over the code to make sure I am doing this correctly. This code could be provided as an example in pvlib once it is working well.

Please see example code and data here:
https://github.com/DuraMAT/pvpro/blob/master/examples/nist-iv02_process.py
https://github.com/DuraMAT/pvpro/tree/master/examples/data

@cwhanse
Copy link
Member

cwhanse commented May 13, 2021

ivtools.sdm.fit_desoto_sandia returns the product of diode factor, number of cells in series and thermal voltage per cell (termed 'a_ref') so that the output of this function are the parameters expected by pvlib.pvsystem.calcparams_desoto.

It would be a nice extension to extract the maximum power point from the IV data. I've seen too many IV curves where the measurement instrument couldn't sweep to 0 voltage, or would sweep past Voc, to trust that the end points are in the IV data. Rather than have the fit function figure out what should be done, it seemed to me to be a better design to have the user resolve those issues.

Looks like we could use a try/except here. Can you tell which IV curve is failing that regression step (it's done once for each IV curve).

This fitting exercise would make a nice addition to the pvlib Examples Gallery, happy to help put that together.

@cwhanse
Copy link
Member

cwhanse commented May 13, 2021

Can you tell which IV curve is failing that regression step (it's done once for each IV curve).

It's index 159. There's several instances where the IV data are slightly non-monotonic (current increases with voltage). Way down in the details of that fitting algorithm, a quadratic spline is fit that preserves monotonicity. That's where the failure originates; for two of the data intervals, the spline has undefined coefficients.

A few points with increasing current wouldn't usually cause this step to fail. Hard to say why it happens in this particular case.

I recommend simply dropping the IV curve as the easiest way to move forward. If you'd rather keep it, then I'd subset the data to remove points where current increases.

@cwhanse
Copy link
Member

cwhanse commented May 13, 2021

Some data quality filtering appears to be in order.

nist_isc_imp_vs_poa

@toddkarin
Copy link
Author

It would be nice to modify the code so that if fitting fails for some of the IV curves, the function returns nan for those entries. We can't always be sure that filtering will remove all the "bad" cruves.

Also, why isn't there a diode factor fit for each run? There is only one diode factor returned for the entire set.

@cwhanse
Copy link
Member

cwhanse commented May 17, 2021

It would be nice to modify the code so that if fitting fails for some of the IV curves, the function returns nan for those entries. We can't always be sure that filtering will remove all the "bad" cruves.

I agree. #1235

Also, why isn't there a diode factor fit for each run? There is only one diode factor returned for the entire set.

pvlib.ivtools.sdm.fit_desoto_sandia fits the Desoto single diode model to the entire set of IV curves, not the single diode equation to each IV curve. The Desoto model assumes that the diode factor is a constant, which is what the fitting method estimates.

If you want instead to fit the single diode equation to each IV curve, I'd suggest pvlib.ivtools.sde.fit_sandia_simple

@toddkarin
Copy link
Author

That makes sense. pvlib.ivtools.sdm.fit_desoto_sandia is the functionality I want, would you be able to implement error handling and try/except so that a few problem IV curves don't stop the function from working?

@toddkarin
Copy link
Author

I just tried using fit_sandia_simple and found an error: here's a MWE:

https://github.com/DuraMAT/pvpro/blob/master/examples/nist-iv03_process.py

Data available:
https://github.com/DuraMAT/pvpro/tree/master/examples/data

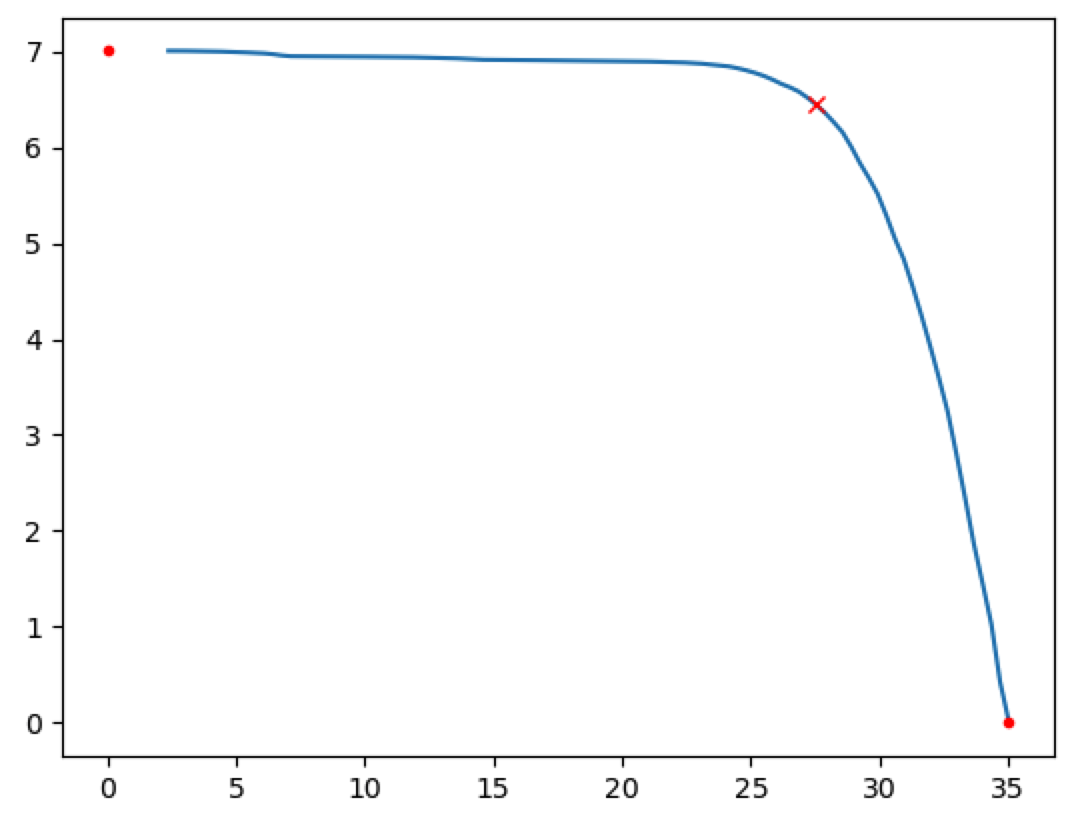
This is the IV curve that the algorithm failed on:

image

@cwhanse
Copy link
Member

cwhanse commented May 18, 2021

Which IV curve index is that failed one? I would like to isolate and save input data that cause failures, to better understand why the algorithm didn't work.

@toddkarin
Copy link
Author

index was 617. Here is the iv curve you can copy/paste.

voltage = np.array([ 0.34, 0.68, 1.02, 1.36, 1.7 , 2.04, 2.38, 2.72, 3.06,
3.4 , 3.74, 4.08, 4.42, 4.76, 5.1 , 5.44, 5.78, 6.12,
6.46, 6.8 , 7.14, 7.48, 7.82, 8.16, 8.5 , 8.84, 9.18,
9.52, 9.86, 10.2 , 10.54, 10.88, 11.22, 11.56, 11.9 , 12.24,
12.58, 12.92, 13.26, 13.6 , 13.94, 14.28, 14.62, 14.96, 15.3 ,
15.64, 15.98, 16.32, 16.66, 17. , 17.34, 17.68, 18.02, 18.36,
18.7 , 19.04, 19.38, 19.72, 20.06, 20.4 , 20.74, 21.08, 21.42,
21.76, 22.1 , 22.44, 22.78, 23.12, 23.46, 23.8 , 24.14, 24.48,
24.82, 25.16, 25.5 , 25.84, 26.18, 26.52, 26.86, 27.2 , 27.54,
27.88, 28.22, 28.56, 28.9 , 29.24, 29.58, 29.92, 30.26, 30.6 ,
30.94, 31.28, 31.62, 31.96, 32.3 , 32.64, 32.98, 33.32, 33.66,
34. , 34.34, 34.68, 35.02, 35.36, 35.7 , 36.04, 36.38, 36.72,
37.06, 37.4 , 37.74, 38.08, 38.42, 38.76, 39.1 , 39.44, 39.78,
40.12, 40.46, 40.8 , 41.14, 41.48, 41.82, 42.16, 42.5 , 42.84,
43.18, 43.52, 43.86, 44.2 , 44.54, 44.88, 45.22, 45.56, 45.9 ,
46.24, 46.58, 46.92, 47.26, 47.6 , 47.94, 48.28, 48.62, 48.96,
49.3 , 49.64, 49.98, 50.32, 50.66, 51. , 51.34, 51.68, 52.02,
52.36, 52.7 , 53.04, 53.38, 53.72, 54.06, 54.4 , 54.74, 55.08,
55.42, 55.76, 56.1 , 56.44, 56.78, 57.12, 57.46, 57.8 , 58.14,
58.48, 58.82, 59.16, 59.5 , 59.84, 60.18, 60.52, 60.86, 61.2 ,
61.54, 61.88, 62.22, 62.56, 62.9 , 63.24, 63.58, 63.92, 64.26,
64.6 , 64.94, 65.28, 65.62, 65.96, 66.3 , 66.64, 66.98, 67.32,
67.66])

current = np.array([7.002207 , np.nan, np.nan, np.nan, np.nan,
np.nan, 7.0034865 , 7.003669 , 7.0023895 , 7.00122 ,
6.999666 , 6.997748 , 6.9957735 , 6.9929585 , 6.989851 ,
6.98594 , 6.981517 , 6.9768375 , 6.9678445 , 6.954868 ,
6.9469715 , 6.94657 , 6.94646 , 6.945583 , 6.9452905 ,
6.9437915 , 6.943389 , 6.942548 , 6.9424755 , 6.9411595 ,
6.9403915 , 6.939624 , 6.938308 , 6.937504 , 6.936444 ,
6.9340675 , 6.9324225 , 6.930266 , 6.9281455 , 6.924198 ,
6.9192625 , 6.913816 , 6.9103155 , 6.909136 , 6.908954 ,
6.9078575 , 6.9067245 , 6.9057 , 6.905408 , 6.904458 ,
6.903544 , 6.9023375 , 6.9009485 , 6.900217 , 6.899669 ,
6.8988285 , 6.8972565 , 6.8962325 , 6.896196 , 6.8946245 ,
6.8929605 , 6.891079 , 6.888666 , 6.886399 , 6.8845345 ,
6.880587 , 6.8759075 , 6.869218 , 6.860006 , 6.851672 ,
6.840778 , 6.822354 , 6.799909 , 6.773516 , 6.742042 ,
6.703695 , 6.65939 , 6.622688 , 6.578529 , 6.514081 ,
6.4402755 , 6.3570395 , 6.259436 , 6.154668 , 6.00263367,
5.831444 , 5.679958 , 5.5138865 , 5.287803 , 5.0422835 ,
4.829594 , 4.54906467, 4.24881 , 3.93047233, 3.597062 ,
3.246129 , 2.80470867, 2.34296433, 1.86391633, 1.4525695 ,
1.02840367, 0.42402575, 0.0112225 , np.nan, np.nan,
np.nan, np.nan, np.nan, np.nan, np.nan,
np.nan, np.nan, np.nan, np.nan])

@cwhanse
Copy link
Member

cwhanse commented May 18, 2021

The nans in the current just after Isc are causing the failure. Can you add this step to your script:

        # drop nans
        v_is_nan = np.isnan(voltage)
        i_is_nan = np.isnan(current)
        v = voltage[~v_is_nan & ~i_is_nan]
        i = current[~v_is_nan & ~i_is_nan]

        out = fit_sandia_simple(voltage=v, current=i,
                                v_mp_i_mp=v_mp_i_mp,
                                v_oc=v_oc,
                                i_sc=i_sc)

@toddkarin
Copy link
Author

toddkarin commented May 18, 2021

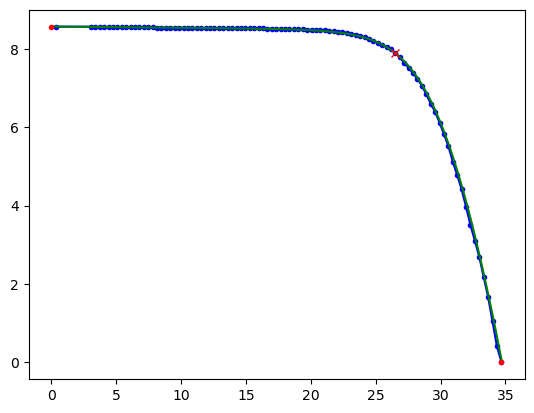
That solves it! We may want to consider adding the "drop nan" code to fit_sandia_simple so people can avoid these issues in the future.

image

@cwhanse
Copy link
Member

cwhanse commented May 19, 2021

We may want to consider adding the "drop nan" code to fit_sandia_simple

I'm open to better handling of nan's, but my current view is that the fit functions shouldn't also do any data cleaning - that should happen upstream in the user's code, perhaps in the future using tools that pvlib could provide.

@toddkarin
Copy link
Author

I've run fit_sandia_simple on this dataset (see figure below). But there is (as expected) a correlation between the diode factor extracted and the saturation current ref. I think this is one of the problems that fit_desoto_sandia was trying to solve? Is there an established way to pick a diode factor from a set of IV curves at various temperature/irradiance conditions?

image

@mikofski
Copy link
Member

Is fit_sandia_simple is already considering the cubic relationship between saturation current and temperature? It would be really useful to color code the dots in the plot above according to temperature. You could also use size to indicate irradiance, or v.v.

@cwhanse
Copy link
Member

cwhanse commented May 25, 2021

Two thoughts:

  • when using fit_sandia_simple you are fitting the single diode equation independently to each IV curve. Where are temperatures obtained? Any deviation between the temperature value, and the actual (unobserved) cell temperature, will show up as a trend in diode factor and saturation current.
  • use of this fitting method assumes that the device which produced the IV curve is well-described by the 5-parameter diode equation, which is an approximation of ideal single-junction device physics.

@mikofski the fit_sandia_simple method is fitting the diode equation individually to each curve. The dependence of each of the five parameter (e.g. saturation current on temperature) isn't accounted for. The idea being that, after fitting the diode equation to each curve, a second fit can be done between each parameter and irradiance/temperature to obtain those dependencies.

@toddkarin
Copy link
Author

At certain times of year, it seems there is a tight relationship between n_diode and Isat:

image

But other times of year, there is significant spread:

image

But this can be corrected by changing Eg_ref:

image

But, I still need a way to find the "true" diode factor and saturation current at ref from this data. Or I can try to go back to pvlib.ivtools.sdm.fit_desoto_sandia

@cwhanse
Copy link
Member

cwhanse commented May 25, 2021

What is the source of the temperature data?

@toddkarin
Copy link
Author

Temperature data is an RTD mounted to the back of the single module. There are 4 different sensors on the one module, I used the one mounted in the center.

@mikofski
Copy link
Member

I would use the cubic temperature dependence of Isat and supply the temperature data to regress the Isat term to fit the constraint like this:

https://github.com/SunPower/PVMismatch/blob/27e4e88f34f07b99ff6d1ff9c4ec85255d05d40a/pvmismatch/pvmismatch_lib/pvcell.py#L137-L146

@cwhanse
Copy link
Member

cwhanse commented Nov 5, 2024

Summarizing possible actions mentioned in this Issue discussion:

  • Have fit_(sdm)_sandia functions optionally extract the maximum power point values from the input IV curves.
  • Add an example or several that show how to use the fitting functions

The other ideas about failing gracefully are tracked in #1235

Sign up for free to join this conversation on GitHub. Already have an account? Sign in to comment
Labels
None yet
Projects
None yet
Development

No branches or pull requests

3 participants