Task performances within/without parsl #57
Comments
|
As we discussed, I think this will be especially interesting when scaling to larger workloads. E.g. when using the 23 well dataset I've been using to look at scaling. Input data for this is here: |
|
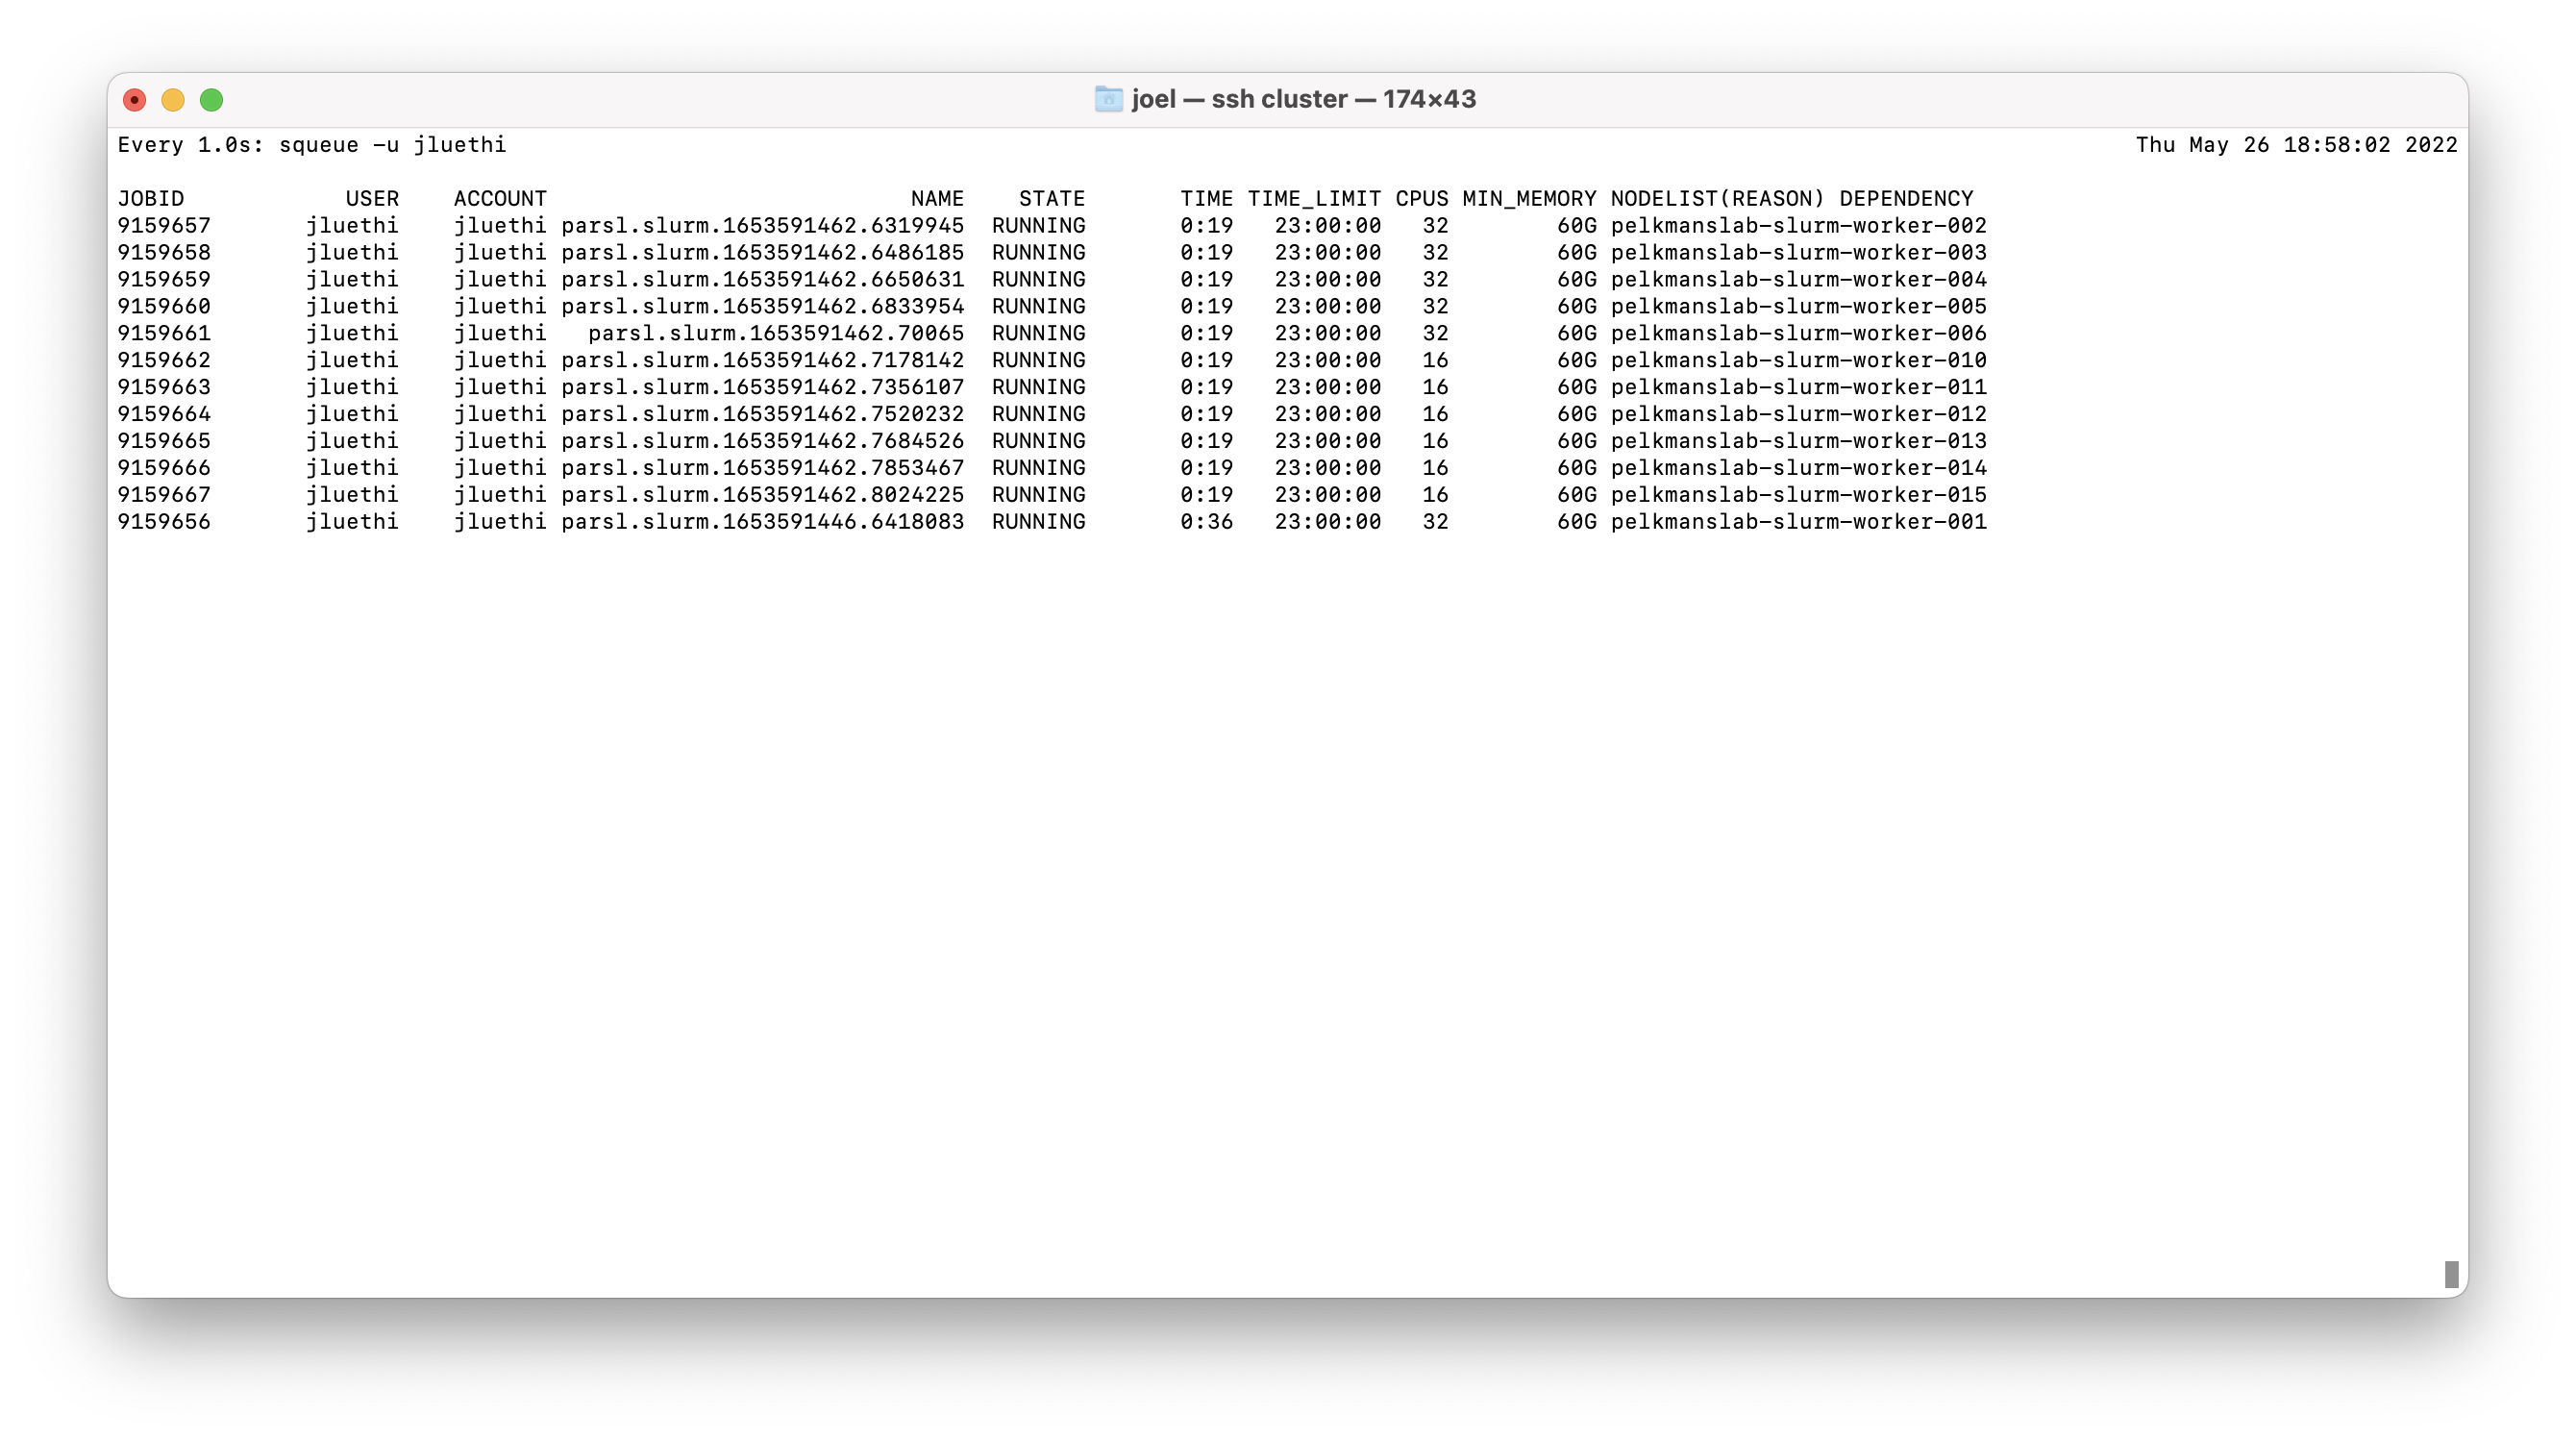
I ran the 23 well dataset and it ran through in a similar timeframe with the parsl scheduler. I used the following parameters in parsl config: Now, what it actually uses resource-wise was a bit confusing: I would expect it needs 12 nodes, running 2 workers per node.
|
|
Concerning your point 1 ( In my current experience, I see that a single-well I've just added the The expected behavior in this case is that parsl submits 23 jobs, each one requiring 8 cores. |
|
Hey @tcompa Sounds promising. Are you running tests for that? may be a nice way to tune # of slurm jobs being created depending on how we want to use a cluster :) |
|
I agree: in principle your two options should be equivalent. On our current cluster (with mixed 16- and 32-cores machines) there could be some issues (if the large machines are busy), but in general I agree. I'm not running tests yet, as I first want to see one of the "big" runs reaching the end. Also, I'm observing some non-ideal behavior in the monitoring (very low CPU usage) that I want to clarify, and that IMHO has higher priority than parallelization. More on this later. (btw: perhaps a smaller dataset would be useful for testing.. 23 wells is fine, but maybe a few less sites?) |
|
I agree! Been thinking about creating a smaller subset for these tests. We have the 4 well, 2x2 sites test set already. I could create a subset that is 10 wells, 5x5 sites? Or what size would you aim for as an intermediate test? Also, my big run with 23 wells & 9 pyramid levels successfully finished on Friday and demos very nicely :) |
|
We are already seeing that the parallelization over wells basically works (up to some details..), so that there's no need for many wells (~10 seems fine). As for the number of sites, we already had a test with wells of 6x6 sites, but I suspect that something was different because that was taking quite a short time (<10 minutes), compared to the wells of 9x8 sites (2-3 hours for the yokogawa_to_zarr part). Then 5x5 sites seems ok. By the way: is there a clear reason for such a speed difference? The number of sites gets multiplied by two (36 -> 72), but the time it takes grows significantly more. This calls for yet another test dataset: could we have one with just one large well of 9x8 sites? This way we can compare it directly with the 6x6 single-well case. Briefly, it would be great to have two new datasets:
|
Quick note: what I wrote in that comment was wrong. |
|
Great, I will create this test cases. If I submit something like |
These are my expectations, but only tests will tell ;) |
|
@tcompa I created the two new test sets we wanted to test Parsl behavior & resource scaling better: The single-well, 9x8 sites test set: Let's run these tests and check:
|
|
Thanks for the new datasets! I'm running a first bunch of tests with this and with Tests include the I'm reporting here the total duration of workflows (as from the monitoring homepage) and the details of the first GLOBAL DURATION:
FIRST/ONLY YOKOGAWA_TO_ZARR:
Partial answer to @jluethi's questions:
By now I'll keep at this (rough) level of detail, but over these days I can try to make some more quantitative summaries (also including the illumination-correction task). The single-well tests are quite convincing, but something is definitely odd for the multi-well one. |


|
Important information to add to the previous benchmark: the number of Z levels. |
|
Memory usage is looking very promising indeed! Regarding Z planes: I created a new subset (just a set of soft-linked files, not full copies) of the 10 well case though that only contains the first 19 Z planes per well, so that we can compare the wells better and don't have confusions in the comparison because of the varying number of Z planes. That decreases the number of files from 24900 to 14250. New test case is available here: I wonder whether access to those files is being slowed down because there are so many files in the raw data folder (or whether there are calls to list all available files that cause the slow-down when we scale up the experiment size) |
Quick answer about the listing: Within a task, I don't think the listing should be the bottleneck. |
|
Another quick comment: with the new Note: take all these numbers with a grain of salt, by now. I'm not sure they're fully robust (e.g. depending on the nodes that are used). More systematic (and possibly somewhat reproducible) tests are planned, also at the single-script level (that is, without parsl managing submissions). |
|
That is good to hear! So now we know what we want: Figure out how we get it from 20 min to 5 min, because the datasets are comparable :) Given that the jobs also don't use that much CPU power: Is it possible the whole thing is IO limited somewhere else and our IO just doesn't handle parallel read access well enough, there is a bottleneck somewhere? How would we test that? |
|
By mistake, I had left the debugging=True flags in all the tests I ran. Needless to say, this makes the timings unreliable, and possibly also interferes with parallelization.. New runs (without debugging) look much better, but I'll try to understand a few things before reporting here. That's great news! More on that probably tomorrow. |
|
(10-wells example runs through in 17 minutes.. but there are a few other things I changed at the same time and I'll need to check them one by one) |
|
I was too optimistic on the importance of debugging, too bad. Still, I found one useful piece of information: running the MIP task on one of our 5x5 wells takes 30 seconds, when it's done directly via SLURM (without parsl). Yes, this is to be compared to roughly 10 minutes when it runs through parsl! This means that the issue at hand is much better defined than it was earlier: parsl is adding a 20x slow-down for (some) tasks. The reason is still unknown, but I think we are better defining the scope of the problem. |
|
TL;DR Here is the global CPU usage for
|

|
Here's another reference run. Same workflow as in #57 (comment), but for FMI data with 2 wells, 5x4 sites, 84 Z layers, 4 channels. The global issue is still there (long time with low activity, and then high-CPU-usage peaks), but for this data it seems much less severe (that is, in the low-activity intervals we almost never have less than a global Notice the high parallelization reached at some times during the Question for the future us: why does this dataset appear as less problematic? Could it be due to the large number of Z planes, or is it a coincidence?
|

|
One last bit of information, again as a reference for future tests. For the test in #57 (comment), I re-ran the MIP part alone in a SLURM job (without parsl, and with Note that wells are analyzed one after the other, and not in parallel. This test ran in ~13 minutes, that is, ~80 seconds per well (on average). The same MIP processing of the 10 wells takes 248 s per well (on average) when running through parsl. Thus it seems that parsl is adding a |
|
Adding some more pieces to the puzzle TL;DR
MORE DETAILS
|

|
Got it! TL;DR Consider the test with 10 5x5 wells. In #57 (comment) I ran it through SLURM directly (no parsl), with the wells running one after the other, and MIP tasks were taking ~80 seconds per well. The same tasks would take much longer when running in parallel (over wells) within parsl, which pointed at some parsl issue. Now I tested the same MIP task within SLURM, but running 10 jobs (one per well) at the same time. Performances are in fact the same as in the parsl case: each SLURM job takes about 4 minutes. This corresponds to the The obvious candidate for this bottleneck is IO. Each one of the 10 tasks is writing data (about 0.5G per well, in the MIP task), and it seems that they are saturating some maximum IO capacity. This is not something we can avoid easily, and we may have to live with it up to a certain level. Possible next moves:
|
|
Great that we know this! As feared, the limits are IO then. Could well be that the current share setup at the pelkmanslab is quite suboptimal for this and limits IO fast. If there are very low-hanging fruits to improve this, certainly interesting (going in the direction of 1). I agree though, we shouldn't dig too deep into filesystem optimizations if we can avoid it. Regarding 2: I think it's very interesting to pursue this direction. We should also keep object storage approaches in mind here. Would be interesting how it would scale with a system like local S3 buckets, as this may be where Zarr files go long term. On 3: Yes, I think we have decent enough performance so that we don't need to stop our other work. We can keep testing with the current setup. But general scaling beyond the 23 well test case is a big interest for Fractal, so I think we take this as baseline performance and keep working on improving it :) |
In fact I wouldn't mind seeing the monitoring of some workflow running at FMI. Perhaps @gusqgm could run such a test? For instance the UZH dataset with 10 5x5 wells is one we looked at several times. If transfering data is easy, then modifying the example script should only take a few minutes. |
|
Yes, we have some of the test data already on FMI servers, will need to check for the 10 well test case. But that will also be an interesting comparison! :) |
|
In case we need some more precise and systematic benchmark for the UZH filesystem, we could try this: https://github.com/deggio/cephfs_bench/blob/main/run_ior.sh (but first I would look at the monitoring of a Fractal run). |
This should be re-tested in view of #92. |
|
The conclusion here is that the limiting factor is disk IO on the Pelkmans lab shares, so Fractal is running as fast as it reasonably can for those tasks. Thus, let's close this issue related to parsl performance and open new issues regarding IO when they become more urgent. |
Fix `Command not found: pytest` in CI (and use poetry 1.2.1) [closes #57]
This is a discussion issue to monitor our improved understanding of what's going on within parsl, and on how it manages the resources to assign to each task. More on this later.
The text was updated successfully, but these errors were encountered: