Description
You guys do an awesome job and we all appreciate it! 🎉
🐛 Bug Report
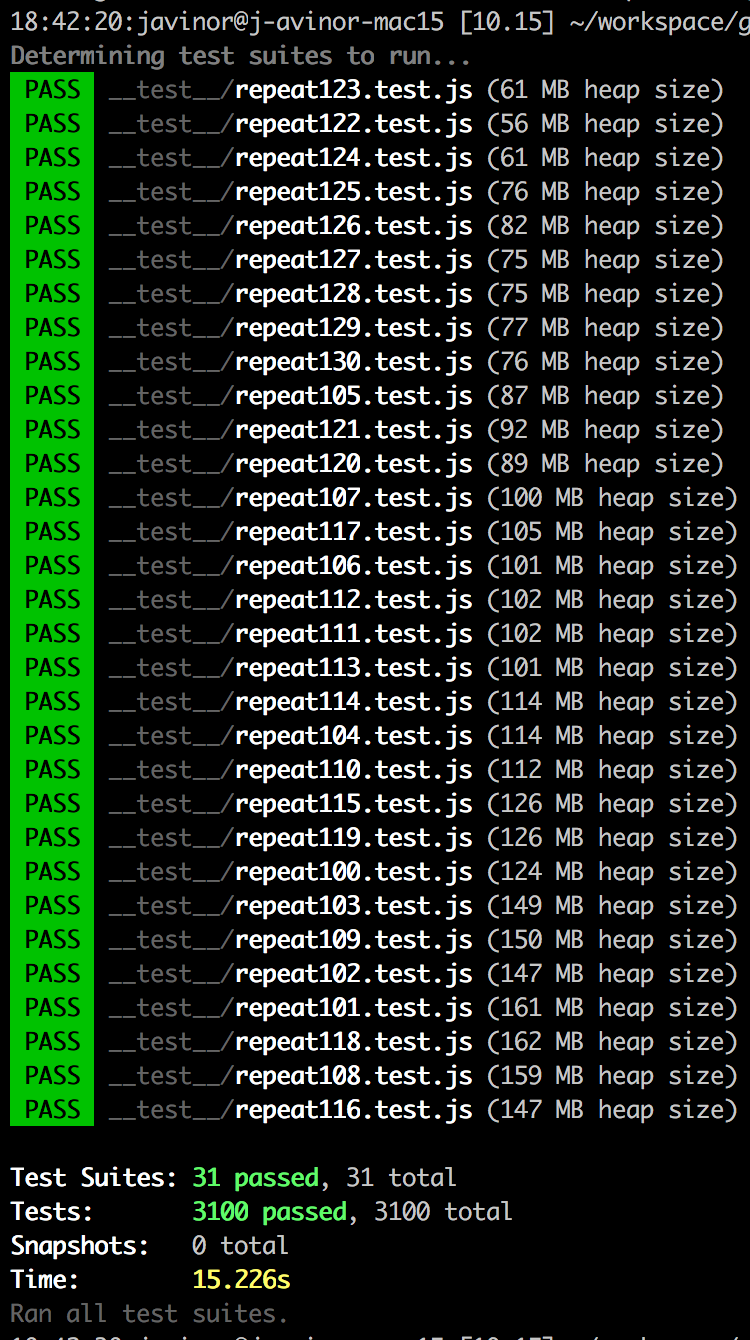
On a work project we discovered a memory leak choking our CI machines. Going down the rabbit hole, I was able to recreate the memory leak using Jest alone.
Running many test files causes a memory leak. I created a stupid simple repo with only Jest installed and 40 tautological test files.
I tried a number of solutions from #7311 but to no avail. I couldn't find any solutions in the other memory related issues, and this seems like the most trivial repro I could find.
Workaround :'(
We run tests with --expose-gc flag and adding this to each test file:
afterAll(() => {
  global.gc && global.gc()
})
To Reproduce
Steps to reproduce the behavior:
git clone [email protected]:javinor/jest-memory-leak.git
cd jest-memory-leak
npm i
npm t
Expected behavior
Each test file should take the same amount of memory (give or take)
Link to repl or repo (highly encouraged)
https://github.com/javinor/jest-memory-leak
Run npx envinfo --preset jest
Paste the results here:
System:
    OS: macOS High Sierra 10.13.6
    CPU: (4) x64 Intel(R) Core(TM) i7-5557U CPU @ 3.10GHz
  Binaries:
    Node: 10.15.0 - ~/.nvm/versions/node/v10.15.0/bin/node
    Yarn: 1.12.3 - /usr/local/bin/yarn
    npm: 6.4.1 - ~/.nvm/versions/node/v10.15.0/bin/npm
  npmPackages:
    jest: ^24.1.0 => 24.1.0