Customize value labels for lower/upper in range charts #83
Comments
|
I think this is definitely a meaningful addition to the range chart, i will add Two suggestions from my side in the meantime:
Chart.Range(
    [1;2],
    [1;1],
    [0.0;0.53622183],
    [1.0;2.0],
    StyleParam.Mode.None,
    Name = "",
    LowerName = "Lower",
    UpperName = "Upper",
    Labels = [])
|> Chart.withY_Axis (yAxis)
|> GenericChart.mapiTrace (fun i t ->
    match i with
    | 0 -> t |> Trace.TraceStyle.TextLabel ["upperOne";"upperTwo"]
    | 1 -> t |> Trace.TraceStyle.TextLabel ["lowerOne";"lowerTwo"]
    | 2 -> t
)
|> Chart.Show
Not sure if you want to get rid of the value display above the label as well though. |
|
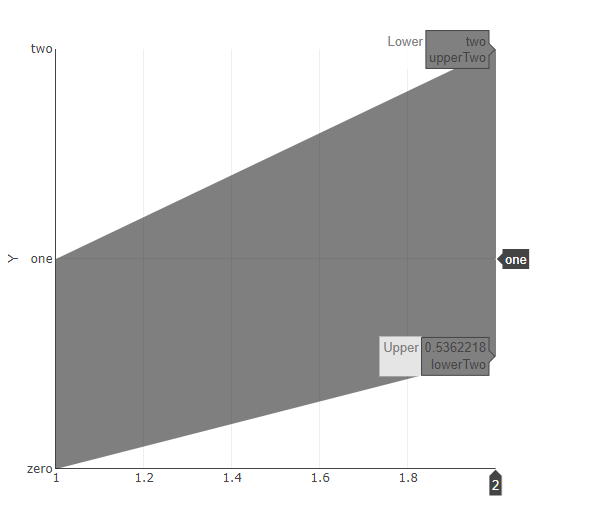
Haha, I was just looking at this again and came back to post my (ugly) solution. I also added let yAxis =
Axis.LinearAxis.init(
Title = "Y",
Showline = true,
Range = StyleParam.Range.MinMax (0.0, 2.0),
Tickvals = [0.0 .. 2.0],
Ticktext = [ "zero"; "one"; "two" ]
)
Chart.Range(
[1;2],
[1;1],
[1.0;2.0],
[0.0;0.53622183],
StyleParam.Mode.None,
Name = "",
LowerName = "Lower",
//LowerLabels = ["nada";"around one half"],
UpperName = "Upper",
//UpperLabels = ["one";"Two!"],
Labels = [])
|> Chart.withY_Axis (yAxis)
|> (fun chart ->
match chart with
| GenericChart.MultiChart ([lower;upper;_], _, _, _) ->
lower?text <- ["nada";"around one half"]
lower?hovertemplate <- "%{text}"
upper?text <- ["one";"Two!"]
upper?hovertemplate <- "%{text}"
chart
| _ -> failwith "Couldn't set dynamic options")
|> Chart.Show |
|
As long as it worked out for you and you found where to customize things, i would count that as a win generally 😄. I added |
Description
Labels for lower/upper values are based on
Ticktextexcept when they don't align perfectly, in which case there does not appear to be a way to customize the labels (they instead show raw values).Repro steps
This looks fine when hovering over values that align perfectly with tick increments:
But when hovering over misaligned values, one sees the raw value:
Expected behavior
A means of providing labels for both upper and lower. In my case, I'm mapping values to times, so when it aligns perfectly I see a time of day, but when it doesn't I see an ugly floating point value.
Actual behavior
As far as I can tell, there's no API for this.
Known workarounds
None.
Related information
2.0.0-preview.1The text was updated successfully, but these errors were encountered: