Skip to content

scale="free" in facet_wrap mess up with the plots [fix-ggplot2 branch] #317

New issue

Have a question about this project? Sign up for a free GitHub account to open an issue and contact its maintainers and the community.

By clicking “Sign up for GitHub”, you agree to our terms of service and privacy statement. We’ll occasionally send you account related emails.

Already on GitHub? Sign in to your account

Closed
zippeurfou opened this issue Dec 1, 2015 · 10 comments
Closed

Comments

@zippeurfou
Copy link

Code:

gt4<-structure(list(hour = c(0L, 0L, 0L, 0L, 0L, 0L, 0L, 6L, 9L, 9L, 
                             9L, 9L, 9L, 9L, 9L, 10L, 10L, 10L, 10L, 10L, 10L, 11L, 11L, 11L, 
                             11L, 11L, 11L, 11L, 12L, 12L, 12L, 12L, 12L, 12L, 12L, 13L, 13L, 
                             13L, 13L, 13L, 13L, 13L, 14L, 14L, 14L, 14L, 14L, 14L, 14L, 15L, 
                             15L, 15L, 15L, 15L, 15L, 17L, 17L, 17L, 17L, 17L, 17L, 17L, 18L, 
                             18L, 18L, 18L, 18L, 18L, 18L, 19L, 19L, 19L, 19L, 19L, 19L, 19L, 
                             20L, 20L, 20L, 20L, 20L, 20L, 20L, 21L, 21L, 21L, 21L, 21L, 21L, 
                             21L, 22L, 22L, 22L, 22L, 22L, 22L, 22L, 23L, 23L, 23L, 23L, 23L, 
                             23L, 23L), day = structure(c(1L, 2L, 3L, 4L, 5L, 6L, 7L, 4L, 
                                                          1L, 2L, 3L, 4L, 5L, 6L, 7L, 1L, 2L, 4L, 5L, 6L, 7L, 1L, 2L, 3L, 
                                                          4L, 5L, 6L, 7L, 1L, 2L, 3L, 4L, 5L, 6L, 7L, 1L, 2L, 3L, 4L, 5L, 
                                                          6L, 7L, 1L, 2L, 3L, 4L, 5L, 6L, 7L, 2L, 3L, 4L, 5L, 6L, 7L, 1L, 
                                                          2L, 3L, 4L, 5L, 6L, 7L, 1L, 2L, 3L, 4L, 5L, 6L, 7L, 1L, 2L, 3L, 
                                                          4L, 5L, 6L, 7L, 1L, 2L, 3L, 4L, 5L, 6L, 7L, 1L, 2L, 3L, 4L, 5L, 
                                                          6L, 7L, 1L, 2L, 3L, 4L, 5L, 6L, 7L, 1L, 2L, 3L, 4L, 5L, 6L, 7L
                             ), .Label = c("Sunday", "Monday", "Tuesday", "Wednesday", "Thursday", 
                                           "Friday", "Saturday"), class = c("ordered", "factor")), pct50 = c(7.08, 
                                                                                                             13.58, 5, 8.89, 6.475, 7.53, 8.525, 5.69, 5.48, 9.12, 4.67, 4.42, 
                                                                                                             3.14, 7.005, 4.29, 4.57, 1.51, 2.41, 1.95, 2.02, 5.54, 8.935, 
                                                                                                             4.235, 5.915, 3.69, 7.14, 3.02, 2.26, 7.61, 6.335, 7.605, 6.855, 
                                                                                                             5.97, 5.63, 6.56, 8.79, 6.39, 6.39, 7.33, 5.59, 2, 8.25, 6.03, 
                                                                                                             10.29, 5.69, 4.16, 4.57, 5.955, 8.9, 9.85, 1.24, 6.38, 5.12, 
                                                                                                             11.555, 11.815, 6.695, 7.19, 6.405, 6.75, 6.045, 6.165, 8.31, 
                                                                                                             7.215, 6.03, 9.71, 6.37, 1.88, 10.49, 11.86, 7.965, 8.345, 6.52, 
                                                                                                             8.69, 8.81, 6.71, 8.07, 11.055, 12.45, 10.94, 10.855, 11.36, 
                                                                                                             12.48, 9.425, 8.52, 10.41, 8.79, 7.775, 6.99, 9.855, 9.91, 10.74, 
                                                                                                             11.005, 8.81, 11.555, 7.17, 9.03, 11.48, 9.81, 7.32, 10.39, 5.985, 
                                                                                                             7.47, 9.365, 10.6), pct10 = c(4.405, 10.292, 3.68, 4.794, 4.719, 
                                                                                                                                           7.482, 3.108, 5.69, 1.508, 9.12, 3.91, 2.277, 1.975, 4.009, 2.848, 
                                                                                                                                           4.57, 1.51, 2.41, 1.95, 2.02, 5.54, 3.094, 1.573, 1.739, 2.762, 
                                                                                                                                           1.295, 1.068, 1.089, 4.042, 3.327, 4.362, 4.145, 3.76, 3.878, 
                                                                                                                                           3.306, 8.79, 6.39, 6.39, 7.33, 5.59, 2, 8.25, 4.932, 5.45, 2.6, 
                                                                                                                                           3.332, 2.9, 2.825, 5.402, 9.85, 1.24, 2.484, 5.12, 10.631, 7.075, 
                                                                                                                                           4.465, 4.112, 3.237, 2.422, 3.54, 3.982, 5.504, 2.779, 2.254, 
                                                                                                                                           4.614, 6.066, 1.664, 2.994, 6.1, 5.621, 5.353, 4.936, 3.94, 2.792, 
                                                                                                                                           3.818, 4.144, 8.267, 10.538, 5.106, 8.048, 6.57, 7.704, 6.13, 
                                                                                                                                           5.706, 6.026, 5.064, 4.947, 5.568, 5.566, 5.408, 3.582, 5.705, 
                                                                                                                                           4.804, 5.023, 5.87, 5.244, 5.715, 4.696, 3.806, 3.742, 3.892, 
                                                                                                                                           4.8, 5.645, 6.1), pct25 = c(5.1475, 11.525, 4.175, 6.33, 5.3775, 
                                                                                                                                                                       7.5, 5.295, 5.69, 1.61, 9.12, 4.195, 3.2625, 1.9975, 5.1325, 
                                                                                                                                                                       3.79, 4.57, 1.51, 2.41, 1.95, 2.02, 5.54, 5.29, 2.485, 3.5825, 
                                                                                                                                                                       3.23, 2.765, 1.4025, 1.35, 5.28, 5.1025, 6.28, 4.66, 4.43, 4.95, 
                                                                                                                                                                       4.5325, 8.79, 6.39, 6.39, 7.33, 5.59, 2, 8.25, 5.5575, 8.865, 
                                                                                                                                                                       3.485, 3.93, 3.35, 4.2475, 6.48, 9.85, 1.24, 3.945, 5.12, 10.9775, 
                                                                                                                                                                       8.8525, 5.5475, 5.725, 4.4725, 4.33, 4.8725, 4.7125, 6.835, 4.4425, 
                                                                                                                                                                       3.67, 6.525, 6.21, 1.745, 5.805, 8.26, 6.6875, 5.5275, 5.855, 
                                                                                                                                                                       6.28, 5.115, 4.635, 5.325, 9.355, 11.715, 8.125, 9.18, 9.27, 
                                                                                                                                                                       10.38, 7.1325, 6.78, 7.54, 6.88, 6.1325, 6.2, 8.24, 6.615, 6.95, 
                                                                                                                                                                       7.6225, 6.29, 5.6875, 6.77, 6.815, 9, 6.585, 6.5375, 6.65, 4.14, 
                                                                                                                                                                       6.26, 7.12, 7.07), pct75 = c(11.28, 17.305, 7.52, 11, 7.5725, 
                                                                                                                                                                                                    7.56, 10.6725, 5.69, 7.2, 9.12, 4.85, 6.295, 4.3575, 8.8775, 
                                                                                                                                                                                                    4.46, 4.57, 1.51, 2.41, 1.95, 2.02, 5.54, 11.52, 6.47, 7.61, 
                                                                                                                                                                                                    4.67, 8.7325, 4.995, 3.67, 9.005, 7.6375, 8.3125, 8.47, 8.135, 
                                                                                                                                                                                                    6.4, 8.9425, 8.79, 6.39, 6.39, 7.33, 5.59, 2, 8.25, 9.1675, 10.76, 
                                                                                                                                                                                                    6.64, 7.29, 6.16, 7.1775, 10.28, 9.85, 1.24, 7.225, 5.12, 12.1325, 
                                                                                                                                                                                                    14.7775, 9.5675, 7.83, 8.215, 9.16, 7.5325, 7.54, 9.615, 9.9875, 
                                                                                                                                                                                                    8.39, 16.245, 6.62, 8.765, 15.175, 15.46, 9.37, 9.43, 9.63, 10.2175, 
                                                                                                                                                                                                    11.665, 10.945, 10.79, 12.7, 16.11, 13.535, 12.31, 14.3, 14.9875, 
                                                                                                                                                                                                    12.1875, 9.95, 11.405, 10.91, 9.43, 11.77, 12.72, 15.525, 13.705, 
                                                                                                                                                                                                    12.4075, 12.65, 12.5625, 8.325, 11.475, 16.6875, 12.955, 7.8075, 
                                                                                                                                                                                                    14.23, 7.595, 10.185, 12.0025, 12.76), pct90 = c(16.104, 19.54, 
                                                                                                                                                                                                                                                     9.032, 12.266, 8.231, 7.578, 10.911, 5.69, 7.8, 9.12, 4.958, 
                                                                                                                                                                                                                                                     8.572, 4.515, 10.001, 4.706, 4.57, 1.51, 2.41, 1.95, 2.02, 5.54, 
                                                                                                                                                                                                                                                     11.808, 8.465, 8.96, 4.676, 9.455, 5.783, 9.28, 11.812, 8.428, 
                                                                                                                                                                                                                                                     8.802, 9.759, 11.734, 6.952, 9.662, 8.79, 6.39, 6.39, 7.33, 5.59, 
                                                                                                                                                                                                                                                     2, 8.25, 9.874, 13.36, 8.362, 9.438, 8.042, 7.801, 12.63, 9.85, 
                                                                                                                                                                                                                                                     1.24, 7.732, 5.12, 12.479, 16.555, 10.295, 9.536, 12.145, 11.186, 
                                                                                                                                                                                                                                                     8.083, 9.829, 10.642, 11.651, 9.806, 20.166, 8.3, 12.896, 17.986, 
                                                                                                                                                                                                                                                     17.62, 12.059, 13.258, 11.72, 10.762, 13.24, 12.744, 13.29, 16.005, 
                                                                                                                                                                                                                                                     17.418, 14.97, 14.855, 19.472, 16.194, 15.51, 12.418, 12.778, 
                                                                                                                                                                                                                                                     12.496, 12.293, 19.546, 13.782, 18.508, 14.83, 13.046, 15.586, 
                                                                                                                                                                                                                                                     13.821, 16.332, 12.726, 18.29, 22.8, 9.808, 15.116, 12.437, 12.32, 
                                                                                                                                                                                                                                                     12.712, 14.97)), .Names = c("hour", "day", "pct50", "pct10", 
                                                                                                                                                                                                                                                                                 "pct25", "pct75", "pct90"), class = "data.frame", row.names = c(NA, 
                                                                                                                                                                                                                                                                                                                                                 -104L))


p = ggplot(data = gt4, aes(x = as.numeric(hour))) +
        geom_line(aes(y = pct50),alpha=1) +
        geom_ribbon(aes(ymin = pct25, ymax = pct75),alpha=0.2) +
        geom_ribbon(aes(ymin = pct10, ymax = pct90),alpha=0.2) +
        facet_wrap(~day,scale="free")
(gg<-ggplotly(p))

Screenshot:

plotly: https://infinit.io/_/sF55n9w
ggplot: https://infinit.io/_/3XTsbrZ

Sessioninfo:

> devtools::session_info()
Session info -----------------------------------------------------------------------------------------------------------------------------------------------------------------------------------------------
 setting  value                       
 version  R version 3.2.2 (2015-08-14)
 system   x86_64, darwin13.4.0        
 ui       RStudio (0.99.486)          
 language (EN)                        
 collate  en_US.UTF-8                 
 tz       America/New_York            
 date     2015-11-30                  

Packages ---------------------------------------------------------------------------------------------------------------------------------------------------------------------------------------------------
 package     * version    date       source                           
 base64enc     0.1-3      2015-07-28 CRAN (R 3.2.0)                   
 colorspace    1.2-6      2015-03-11 CRAN (R 3.2.0)                   
 devtools      1.9.1.9000 2015-11-30 Github (hadley/devtools@b4edf3e) 
 digest        0.6.8      2014-12-31 CRAN (R 3.2.0)                   
 formatR       1.2.1      2015-09-18 CRAN (R 3.2.0)                   
 ggplot2     * 1.0.1.9003 2015-11-30 Github (hadley/ggplot2@23a748f)  
 gridExtra     2.0.0      2015-07-14 CRAN (R 3.2.0)                   
 gtable        0.1.2      2012-12-05 CRAN (R 3.2.0)                   
 htmltools     0.2.6      2014-09-08 CRAN (R 3.2.0)                   
 htmlwidgets   0.5        2015-06-21 CRAN (R 3.2.0)                   
 httr          1.0.0.9000 2015-11-30 Github (hadley/httr@733530e)     
 jsonlite      0.9.19     2015-11-28 CRAN (R 3.2.2)                   
 knitr         1.11       2015-08-14 CRAN (R 3.2.2)                   
 labeling      0.3        2014-08-23 CRAN (R 3.2.0)                   
 magrittr      1.5        2015-11-17 Github (smbache/magrittr@00a1fe3)
 memoise       0.2.1      2014-04-22 CRAN (R 3.2.0)                   
 munsell       0.4.2      2013-07-11 CRAN (R 3.2.0)                   
 packrat       0.4.6-2    2015-11-25 Github (rstudio/packrat@2d9b533) 
 plotly      * 2.0.4      2015-11-30 Github (ropensci/plotly@e3ecaef) 
 plyr          1.8.3      2015-06-12 CRAN (R 3.2.0)                   
 R6            2.1.1      2015-08-19 CRAN (R 3.2.0)                   
 Rcpp          0.12.2     2015-11-15 CRAN (R 3.2.2)                   
 scales        0.3.0      2015-08-25 CRAN (R 3.2.0)                   
 stringi       1.0-2      2015-11-30 Github (Rexamine/stringi@6d9ed3b)
 stringr       1.0.0.9000 2015-11-30 Github (hadley/stringr@a67f8f0)  
 viridis       0.3.1      2015-10-11 CRAN (R 3.2.0)                   
 yaml          2.1.13     2014-06-12 CRAN (R 3.2.0)                   
@cldougl
Copy link
Member

cldougl commented Jan 19, 2016

library(plotly)
df<-read.csv('test_df.csv')

p <- ggplot(df,
       aes(x=as.Date(Data_date))) +
  geom_line(aes(y=value, group=Data_source, colour=Data_source)) +
  geom_point(data=df[df$flag>0,],aes(y=(value*flag)),size=2) +
  theme(plot.margin = unit(c(2, 0.5, 1, 1), "cm"), plot.title=element_text(size=10,vjust=0.5),legend.position="none") +
  facet_wrap( ~ Measure_id, ncol = 3, scales="free")
p <- ggplotly(p)
plotly_POST(p)

Should be similar to:

But is resulting in:

@evanhenry
Copy link

I have the same issue regarding facet_wrap, everything works fine until ggplotly():
code:

hives <- read.csv("~/Documents/pltlyhive.csv")
##remove space in hives column
hives$Hive<-str_replace_all(string=hives$Hive, pattern=" ", repl="")
hives <- read.csv("~/Documents/pltlyhive.csv")
##remove space in hives column
hives$Hive<-str_replace_all(string=hives$Hive, pattern=" ", repl="")

#works fine w/o plotly
plt<- ggplot(hives,aes(x=Temp,y=Humidity)) + geom_hex(bins=20) + facet_wrap(~ Hive)
plt
##plotly does not work
pltp<-ggplotly(plt)
pltp #w/ plotly graphs dont render,

ggplot:
ggplot

plot_ly:
plotly

ggplotly() does not render the graphs, but when the cursor moves over the graphs the plotly "wizard" appears and highlights the graphed data point

@cpsievert
Copy link
Collaborator

This is likely happening due to a different reason. Please install the dev version (devtools::install_github("ropensci/plotly") and let me know if you're still having problems.

@evanhenry
Copy link

Still same issue, both for facet_grid and facet_wrap:

plt<- ggplot(hives,aes(x=Temp,y=Humidity)) + geom_hex(bins=20) 
plt + facet_wrap( ~ Hive)
ggplotly() ##plotly not rendering
plt<- ggplot(hives,aes(x=Temp,y=Humidity)) + geom_hex(bins=20) 
plt + facet_grid(. ~ Hive)
ggplotly() ##plotly not rendering

Any ideas? Thanks

@cpsievert
Copy link
Collaborator

I'll need a reproducible example to pinpoint the issue

@evanhenry
Copy link

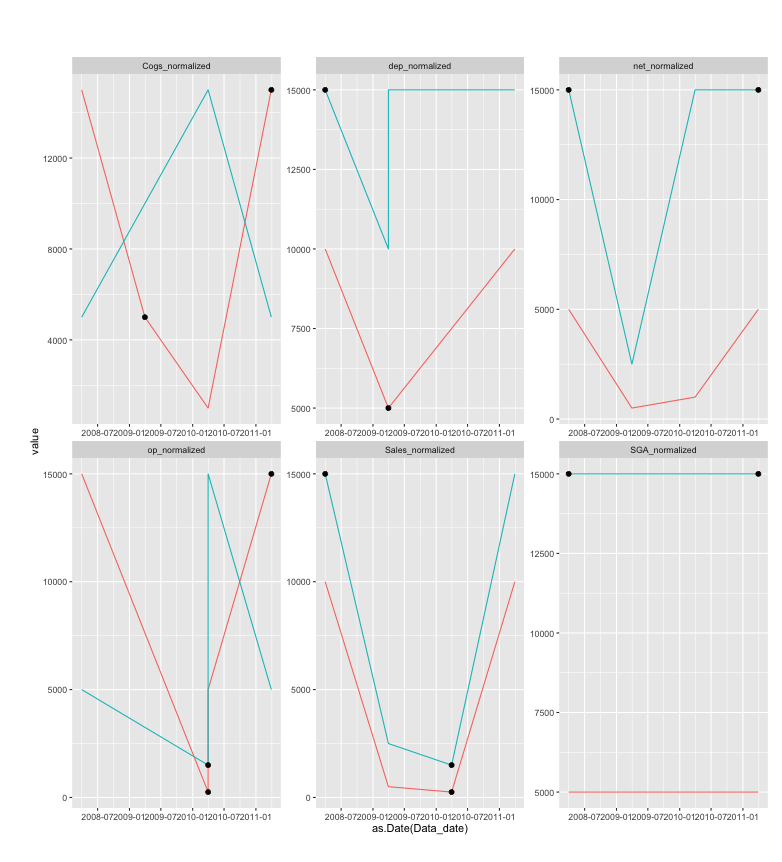
Here is link to relavant .R and .csv:
https://github.com/evanhenry/plotly-scratch

@Ni-Ar
Copy link

Ni-Ar commented Sep 21, 2017

I still have a similar issue with facet_wrap() and ggplotyl(). When I use ggplotly() I don't get the rendered data in only one of the facets, usually the first or the lower left panel. All the other facets render perfectly.
I'm currently using versions
packageVersion('plotly')
‘4.7.1’
packageVersion('ggplot2')
‘2.2.1’
And the problem still occurs when using the dev version of ggplot2 through devtools::install_github('hadley/ggplot2').

I can share some dummy data and examples but before doing that I'd like to know if this issue got fixed somewhere else on the web were I could look.
Thanks

@diplodata
Copy link

@cpsievert Do you consider this bug resolved, or perhaps too tricky to fix?

@titaniumtroop
Copy link

I was having this problem until updating to the dev version of plotly and ggplot2 just now, which fixed the issue.

> packageVersion("plotly")
[1] ‘4.7.1.9000’
> packageVersion("ggplot2")
[1] ‘2.2.1.9000’

@kojisposts
Copy link

Hi! Just wanted to note that facetting on geom_hex continues to not work (the tooltip doesn't appear at all), and downloading the dev version doesn't seem to resolve the problem.

Sign up for free to join this conversation on GitHub. Already have an account? Sign in to comment
Labels
None yet
Projects
None yet
Development

No branches or pull requests

8 participants