gif in the README #1
Comments
|
Fixed by 9126a70. |
|
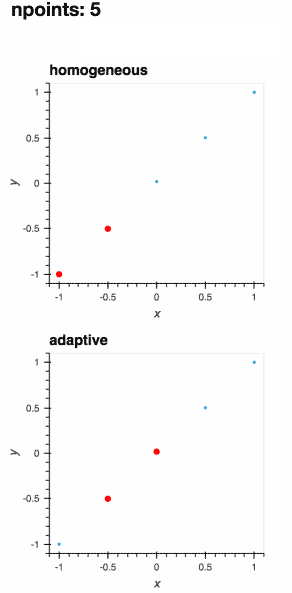
When holoviz/holoviews#1977 and holoviz/holoviews#2260 are fixed we can add a script that will reproduce these images. ATM I used LICEcap + Photoshop to edit them. This is the code: %%output fps=5
offset = random.uniform(-0.3, 0.3)
def f(x, offset=offset):
a = 0.01
return x + a**2 / (a**2 + (x - offset)**2)
learner = adaptive.Learner1D(f, bounds=(-1, 1))
def plot(learner):
learner2 = adaptive.Learner1D(f, bounds=learner.bounds)
xs = np.linspace(*learner.bounds, len(learner.data))
learner2.add_data(xs, map(f, xs))
return (hv.Scatter(learner.data)[-1:1, -1:1].relabel('adaptive')
+ hv.Scatter(learner2.data).relabel('homogeneous grid')).cols(1)
plots = []
for i in range(100):
xs, _ = learner.choose_points(1)
learner.add_data(xs, map(learner.function, xs))
plots.append((i+1, plot(learner)))
hv.HoloMap(plots, kdims=['N points']).collate()def ring(xy):
import numpy as np
x, y = xy
a = 0.2
return x + np.exp(-(x**2 + y**2 - 0.75**2)**2/a**4)
learner = adaptive.Learner2D(ring, bounds=[(-1, 1), (-1, 1)])
import itertools
def plot(learner):
learner2 = adaptive.Learner2D(ring, bounds=learner.bounds)
xs = np.linspace(*learner.bounds[0], learner.n**0.5)
ys = np.linspace(*learner.bounds[1], learner.n**0.5)
xys = list(itertools.product(xs, ys))
learner2.add_data(xys, map(ring, xys))
return (learner2.plot().relabel('Homogeneous grid')
+ learner.plot().relabel('With adaptive')
+ learner2.plot(tri_alpha=0.5).relabel('Homogeneous grid')
+ learner.plot(tri_alpha=0.5).relabel('With adaptive')).cols(2)
plots = []
for i in range(100):
N = 10
xs, _ = learner.choose_points(N)
learner.add_data(xs, map(learner.function, xs))
plots.append((learner.n, plot(learner)) |
|
I am going to put this cooler gif in the import adaptive
from functools import partial
import holoviews as hv # Plotting
import numpy as np
adaptive.notebook_extension()
def f(x, offset=0.07357338543088588):
a = 0.01
return x + a**2 / (a**2 + (x - offset)**2)
def plot_loss_interval(learner):
if learner.npoints >= 2:
x_0, x_1 = max(learner.losses, key=learner.losses.get)
y_0, y_1 = learner.data[x_0], learner.data[x_1]
plot = hv.Scatter(([x_0, x_1], [y_0, y_1]))
else:
plot = hv.Scatter([])
return plot.opts(style=dict(size=6, color='r'))
learner = adaptive.Learner1D(f, bounds=(-1, 1))
plots = {0: learner.plot()}
for n in range(1, 101):
xs, _ = learner.choose_points(1)
learner.add_data(xs, map(learner.function, xs))
plots[n] = (learner.plot() * plot_loss_interval(learner))[:, -1.1:1.1]
hm_plots = hv.HoloMap(plots, kdims=['npoints']).relabel('adaptive')
hom_learner = adaptive.Learner1D(f, bounds=(-1, 1), loss_per_interval=adaptive.learner.learner1D.uniform_loss)
hom_plots = {0: hom_learner.plot()}
for n in range(1, 101):
xs, _ = hom_learner.choose_points(1)
hom_learner.add_data(xs, map(hom_learner.function, xs))
hom_plots[n] = (hom_learner.plot() * plot_loss_interval(hom_learner))[:, -1.1:1.1]
hm_hom_plots = hv.HoloMap(hom_plots, kdims=['npoints']).relabel('homogeneous')
(hm_hom_plots + hm_plots).cols(1)
Because of |
|
I've added these examples in the docs in b1ebe92. |
|
This is another one:
|

Sign up for free
to join this conversation on GitHub.
Already have an account?
Sign in to comment
The text was updated successfully, but these errors were encountered: